
(1). What is hypothesis?
A hypothesis is a statement or an assumption about a phenomenon or a relationship between variables. It is a proposed explanation for a set of observations or an answer to a research question.
In research, hypotheses are tested through experiments or data analysis using a test statistic. The aim of hypothesis testing is to determine if the evidence supports or rejects the hypothesis. If the evidence supports the hypothesis, it provides evidence for the validity of the hypothesis. If the evidence does not support the hypothesis, it may need to be revised or rejected and a new hypothesis may be proposed.
Learn more: Testing of Hypothesis: Theory and Steps
They hypotheses may be directional or non-directional. Directional hypotheses specify the direction of the relationship between the variables, whereas the non-directional hypotheses only state the presence of a relationship without specifying the direction.
(2). What is Hypothesis Testing in Statistics?
It is a method used to make a decision about the validity of the hypothesis concerning a population parameter based on a random sample from that population. It involves the calculation of a test statistic, and the comparison of this test statistic to a critical value determined from the distribution of that test statistic. The decision is made by comparing the p-value (p-value is described below) with a significance level, typically 0.05. If the p-value is less than the significance level, the null hypothesis is rejected and the alternative hypothesis is accepted.
Learn more: Graphical Representation of Data
(3). What is Test-Statistic?
A test statistic is a numerical value calculated from the sample data. It is used to test the hypothesis about a population parameter. Test-statistic summarizes the sample information in to a single value and helps to determine the significance of the results. The choice of test statistic depends on the specific hypothesis test being conducted and the type of data. Commonly used test statistics are t-statistic (t-test), z-statistic (z-test), F-statistic (F-test) and the chi-squared statistic (Chi-square test). The test statistic is used in conjunction with a critical value and a p-value to make inferences about the population parameter and determine whether the null hypothesis should be rejected or not.
| You may also like NOTES in... | ||
|---|---|---|
| BOTANY | BIOCHEMISTRY | MOL. BIOLOGY |
| ZOOLOGY | MICROBIOLOGY | BIOSTATISTICS |
| ECOLOGY | IMMUNOLOGY | BIOTECHNOLOGY |
| GENETICS | EMBRYOLOGY | PHYSIOLOGY |
| EVOLUTION | BIOPHYSICS | BIOINFORMATICS |
(4). What is null hypothesis?
The null hypothesis is a statement in statistical testing that assumes no significant difference exists between the tested variables or parameters. It is usually denoted as H0 and serves as a starting point for statistical analysis. The null hypothesis is tested against an alternative hypothesis, which is the opposite of the null hypothesis and represents the researchers’ research question or prediction of an effect. The aim of statistical testing is to determine whether the evidence in the sample data supports the rejection of the null hypothesis in favor of the alternative hypothesis. If the null hypothesis can’t be rejected, it doesn’t mean it’s proven to be true, it just means that the data do not provide enough evidence to support the alternative hypothesis.
(5). What is alternate hypothesis?
The alternative hypothesis is a statement in statistical testing that contradicts or negates the null hypothesis and represents the researchers’ research hypothesis. Alternate hypothesis is denoted as H1 or Ha. The alternative hypothesis is what the researcher is hoping to prove through the statistical analysis. If the results of the analysis provide strong evidence, the null hypothesis is rejected in favor of the alternative hypothesis. The alternative hypothesis typically represents a non-zero difference or a relationship between variables, whereas the null hypothesis assumes no difference or relationship.
(6). What is Level of Significance in Statistics?
The level of significance in statistics refers to the threshold of probability or p-value below which a result or finding is considered statistically significant. It means that, it is unlikely to have occurred by chance. Level of significance is usually set at 5% (0.05) and indicates the maximum probability of accepting the null hypothesis when it is actually false (Type I error).
Learn more: Difference between Type-I and Type-II Errors
(7). What are statistical errors?
Statistical errors are mistakes can occur during the process of statistical analysis. There are two types of statistical errors: Type I errors and Type II errors.
(8). What is type-I error in statistics?
The type I error, also known as a false positive, is a statistical error that occurs when the null hypothesis is rejected when it is actually true. In other words, a Type I error occurs when a significant result is obtained by chance, leading to the incorrect conclusion that there is a real effect or relationship present.
In hypothesis testing, the level of significance (alpha) is used to control the probability of making a Type I error. A level of significance of 0.05, for example, means that there is a 5% chance of rejecting the null hypothesis when it is actually true. The level of significance is a threshold that is used to determine whether the observed result is significant enough to reject the null hypothesis. Minimizing Type I errors is important in statistical analysis because a false positive can lead to incorrect conclusions and misguided decisions.
(9). How to reduce the chance of committing a type-I error?
There are several ways to reduce the chance of committing a Type I error, they are:
Ø Increasing the sample size: Increasing the sample size increases the precision and power of the statistical test. High sample size reduces the probability of observing a significant result by chance.
Ø Decreasing the level of significance (alpha): Decreasing the level of significance reduces the probability of rejecting the null hypothesis when it is actually true. A lower level of significance increases the threshold for rejecting the null hypothesis, making it less likely that a Type I error will occur.
Ø Conducting a replication study: Replicating the study with a new sample of data helps to confirm or refute the results and reduces the chance of observing a false positive result by chance.
Ø Using more stringent statistical methods: More sophisticated statistical methods, such as Bayesian analysis, can provide additional information to help reduce the probability of making a Type I error.
Ø Careful interpretation of results: Proper interpretation of results and thorough understanding of the underlying statistical methods used can also help reduce the chance of making a Type I error.
It is very important have a balance in reducing Type I errors with the risk of increasing the chance of making a Type II error. The statistical analysis implemented with an aim of reducing the chance of a Type I error may also the chance of a Type II error.
(10). What is type-II error in statistics?
Type II error, also known as a false negative, is a statistical error that occurs when the null hypothesis is not rejected when it is actually false. In other words, a Type II error occurs when a significant difference or relationship is not detected in the data, despite its existence in the population.
In hypothesis testing, the probability of making a Type II error is represented by beta (beta error) and is related to the sample size and the magnitude of the effect being tested. The larger the sample size or the larger the effect, the lower the probability of making a Type II error.
Minimizing Type II errors is important because a false negative can lead to incorrect conclusions and missed opportunities for discovery. To reduce the probability of a Type II error, researchers may use larger sample sizes, increase the level of significance (alpha), or use more powerful statistical methods.
(11). How to reduce the chance of committing the type-II error in statistics?
There are several ways to reduce the chance of committing a Type II error in statistics, they are:
Ø Increasing the sample size: Increasing the sample size increases the precision and power of the statistical test. Increased sample size reduces the probability of failing to detect a significant result.
Ø Increasing the level of significance (alpha): Increasing the level of significance reduces the probability of failing to reject the null hypothesis when it is actually false. A higher level of significance decreases the threshold for rejecting the null hypothesis, making it more likely that a significant result will be detected.
Ø Using a more powerful statistical test: More powerful statistical tests, such as a two-sample t-test or ANOVA, can increase the ability to detect a significant difference or relationship in the data.
Ø Increasing the magnitude of the effect being tested: A larger effect size makes it more likely that a significant result will be detected, reducing the probability of a Type II error.
Ø Conducting a pilot study: A pilot study can provide an estimate of the sample size needed for the main study, increasing the ability to detect a significant result.
It’s important to balance reducing the probability of a Type II error with the risk of increasing the chance of making a Type I error. A statistical analysis that offers to reduce the chance of a Type II error may also increase the chance of a Type I error.
(12). What is p-value?
The p-value is a statistical measure that represents the probability of obtaining a result as extreme or more extreme than the one observed, given that the null hypothesis is true. In other words, the p-value is the probability of observing the data if the null hypothesis is true.
In hypothesis testing, the p-value is compared to the level of significance (alpha) to determine whether the null hypothesis should be rejected in favor of the alternative hypothesis. If the p-value is less than the level of significance, the null hypothesis is rejected, and the result is considered statistically significant. A small p-value indicates that it is unlikely that the result was obtained by chance, and provides evidence against the null hypothesis.
It’s important to note that the p-value does not indicate the magnitude of the effect or the likelihood of the alternative hypothesis being true. It only provides information about the strength of the evidence against the null hypothesis. A low p-value is not proof of the alternative hypothesis, but it does provide evidence against the null hypothesis and supports the conclusion that the effect or relationship is real.
(13). What is the importance of hypothesis testing in research?
Hypothesis testing is an important tool in research as it allows researchers to test their ideas and make inferences about a population based on a sample of data. It provides a systematic and objective approach for evaluating the evidence and making decisions about the validity of a claim.
Evaluating claims: Hypothesis testing provides a way to evaluate claims and determine if they are supported by the data. By testing hypotheses and comparing the results to a predetermined level of significance, researchers can determine if their ideas are supported by the data.
Making decisions: Hypothesis testing helps researchers make decisions about the validity of their ideas and the direction of their research. It provides a way to determine if a claim is supported by the data.
| You may also like... | ||
|---|---|---|
| NOTES | QUESTION BANK | COMPETITIVE EXAMS. |
| PPTs | UNIVERSITY EXAMS | DIFFERENCE BETWEEN.. |
| MCQs | PLUS ONE BIOLOGY | NEWS & JOBS |
| MOCK TESTS | PLUS TWO BIOLOGY | PRACTICAL |
Enhancing the quality of research: Hypothesis testing ensures that research is conducted in a systematic and rigorous manner, which enhances the quality and validity of the research findings. By using a hypothesis testing framework, researchers can ensure that their results are not due to chance and that their conclusions are based on valid evidence.
Understanding the phenomena: By testing hypotheses and evaluating the evidence, hypothesis testing helps researchers gain a better understanding of the phenomena they are studying. It provides a way to determine if a claim is supported by the data and to gain insights into the underlying relationships and patterns in the data.
(14). What are the different types of hypothesis testing tools (test-statistics) available in statistics?
There are several different types of hypothesis testing tools available in statistics which are summarized below. The choice of which tool to use depends on the research question, the type of data being analyzed, and the underlying assumptions of the test.
Z-test: A Z-test is used to test the mean of a population when the population standard deviation is known. It is commonly used to test the difference between two means.
t-test: A t-test is used to test the mean of a population when the population standard deviation is unknown. It is commonly used to test the difference between two means. t-test is performed when the sample size is small (n<30).
ANOVA: Analysis of Variance (ANOVA) is a hypothesis testing tool used to test the equality of means for two or more groups. It is used to determine if there are significant differences among the means of multiple groups. Here comparison between and within groups are done to find out the significance.
Chi-Square Test: The Chi-Square Test the discrepancies between the observed and expected data. It is used to test the independence of two categorical variables. It is commonly used to test if there is a relationship between two categorical variables.
F-test: F-test is variance ratio test. An F-test is used to test the equality of variances for two or more groups. It is commonly used in ANOVA to determine if the variances of the groups are equal.
Non-Parametric Tests: Non-parametric tests are hypothesis tests that do not assume a normal distribution of the data. Examples include the Wilcoxon rank-sum test, the Kruskal-Wallis test, and the Mann-Whitney U test.
(15). What is statistical power?
Statistical power is the probability of correctly rejecting a false null hypothesis in a statistical hypothesis test. It is the complement of the probability of making a type II error, which is failing to reject a false null hypothesis.
The power of a hypothesis test is determined by several factors such as sample size, the effect size, the level of significance and the variability of the data. Increasing the sample size, reducing the variability of the data, or increasing the effect size will generally increase the power of the test.
The power of a hypothesis test is an important consideration in the design of experiments and the selection of sample sizes, as it affects the ability of the test to detect meaningful differences between groups or to reject false null hypotheses. It is also important to consider the trade-off between the power of the test and the level of significance, as increasing the power of the test typically requires a decrease in the level of significance.
Learn more: Principles of Experimental Designs
Learn More: Different Types of Experimental Designs
(16). What is one-tailed and two-tailed test in statistics?
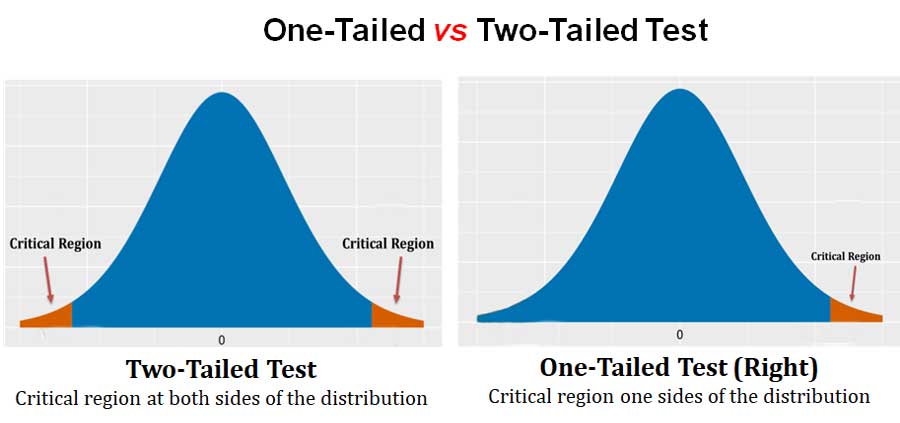
A one-tailed test and a two-tailed test are two types of statistical hypothesis tests used to determine if there is a significant difference between two groups or if a relationship exists between two variables.
A one-tailed test is a hypothesis test that tests the direction of the relationship between two variables. For example, if a researcher wants to determine if a new drug is better than a placebo, a one-tailed test would be used. In a one-tailed test, the alternative hypothesis specifies the direction of the difference, either the new drug is better than the placebo or it is not.
A two-tailed test, on the other hand, does not specify the direction of the difference between the two groups or variables. It only tests if there is a significant difference between the two groups or variables in either direction. For example, if a researcher wants to determine if a new drug is different from a placebo, a two-tailed test would be used. In a two-tailed test, the alternative hypothesis states that the new drug is different from the placebo but does not specify in which direction the difference lies (example- the efficiency may be less or more).
The choice between a one-tailed and a two-tailed test depends on the research question, the data, and the underlying assumptions of the test. One-tailed tests are typically used when the direction of the difference is already known or when the research question is very specific, while two-tailed tests are used when the direction of the difference is not known or when the research question is more general.
(17). What is critical region?
In statistical hypothesis testing, a critical region is the set of values of a test statistic for which the null hypothesis is rejected. The critical region is determined by the level of significance, which is the probability of making a type I error, or incorrectly rejecting a true null hypothesis.
The critical region is often defined as the region of the distribution of the test statistic that is beyond a certain threshold. The threshold is determined by the level of significance and the type of test being conducted (one-tailed or two-tailed). If the calculated test statistic falls within the critical region, the null hypothesis is rejected and the alternative hypothesis is accepted. If the calculated test statistic falls outside of the critical region, the null hypothesis is not rejected. Thus, the critical region is a key component of hypothesis testing, as it determines the decision rule for accepting or rejecting the null hypothesis.
<<< Back to Biostatistics Notes Page
Dear readers
I hope you have enjoyed reading this article and finding the content informative. We believe that this article helped you to understand the Hypothesis Testing Questions and Answers. I would like to take this opportunity to request your COMMENTS on the topics I have covered. Whether you have a suggestion, a question about the topic, or simply want to share your thoughts, I would love to hear from you. Your comments provide me with the opportunity to engage in meaningful discussion and continue to write with the best possible content in Biology.
So, please don’t hesitate to leave a comment below. I appreciate your support and look forward to hearing from you.
Best regards, [Admin, EasyBiologyClass]