
Chi-square test is a Statistical Hypothesis Testing tool (Test Statistic). The statistical hypothesis test tool is a method of statistical inference to decide the suitability of the data we have to support a particular hypothesis. The Chi-square test is written as χ2. The test is developed by Karl Pearson. In the present post, we will discuss the characteristics and different types of Chi-square tests. We will also see the applications of Chi-square test.
Table of Content
Chi square Test: Definition
Characteristics of Chi square Test
Chi square Distribution
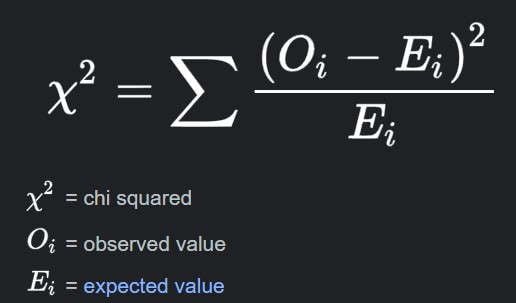
Chi square Formula
Chi square Table
Conditions for Chi square Test
Types of Chi square Test
Applications of Chi square Test
Chi Square Test: Definition
Ø Chi square test is a statistical hypothesis testing tool.
Ø Definition: Chi-square test is used to describe the discrepancies between the ‘OBSERVED’ (actual) and ‘EXPECTED’ (theoretical) values.
Ø Example: A geneticist performing a hybridization experiment, where is crossed a homozygous tall pea plant with a homozygous dwarf pea plant. He assumes that the tall and dwarf characters are controlled by two alleles of a single gene and he expects the 3 : 1 ratio (monohybrid ratio) in the F2 progenies. i.e, if he gets 100 progenies in the F2, 75 will be tall and 25 will be dwarf. However, in the actual experiment the geneticist got 100 progenies and out of which 80 were tall and 20 were dwarf. Here there is a discrepancy between the observed (80 tall and 20 dwarf) and expected (75 tall and 25 dwarf) values. In such cases, the geneticist can use Chi-square test to check whether the discrepancy between observed and expected is significant or not. If the test results indicate that the discrepancy is not significant, it can be concluded that the segregation is still according to the monohybrid ratio. Similarly, if the test results indicate that the discrepancy is significant, it can be concluded that the segregation is not according to the 3 : 1 ratio.
| You may also like NOTES in... | ||
|---|---|---|
| BOTANY | BIOCHEMISTRY | MOL. BIOLOGY |
| ZOOLOGY | MICROBIOLOGY | BIOSTATISTICS |
| ECOLOGY | IMMUNOLOGY | BIOTECHNOLOGY |
| GENETICS | EMBRYOLOGY | PHYSIOLOGY |
| EVOLUTION | BIOPHYSICS | BIOINFORMATICS |
Ø The Chi-square test measure how closely the observed value fits to the theoretical value.
Ø The calculated value of χ2 is a ‘STATISTIC’ (since it is derived from sample).
Ø χ2 is NOT a parametric test (values are not derived from a population).
Ø χ2 is best applied to binned data (data arranged as classes – rows and columns)
Characteristics of χ2 Test
Ø The calculated value of χ2 will be always positive.
Ø If the differences between observed (O) and expected (E) values are greater, the χ2 will be greater, and vice versa.
Ø If there is NO difference between O and E, then the χ2 will be zero.
Ø χ2 is a statistic, NOT a parameter.
Chi Square Distribution
Ø In the probability theory, the chi-squared distribution is the distribution of a sum of the square of k independent standard normal random variables with k degrees of freedom.
Ø It is a special case of the gamma distribution.
Ø Chi square distribution is one of the most popularly used probability distributions in inferential statistics.
Ø It has tremendous usage in hypothesis testing.
Ø It has also a great use in confidence internals.
Chi Square Formula
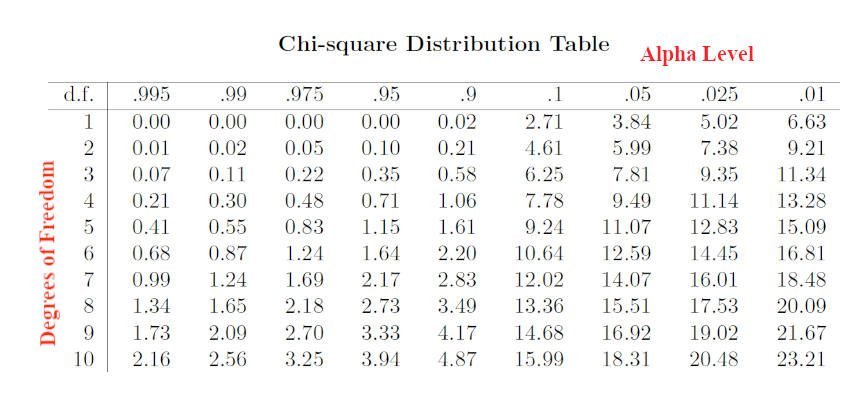
Chi square Table
Ø A table which shows the critical values of the Chi-Square distribution is called Chi square table
Ø We need to know TWO values to use the Chi square table
(1). Degree of freedom
(2). The alpha level of the test
Ø The degree of freedom is calculated as (r – 1) x (c – 1), where r is the number of rows and c is the number of columns when the data is presented as a table.
Ø The alpha level indicates the confidence level. The commonly used alpha levels are 0.01, 0.05, and 0.10 for 99%, 95% and 90% confidence respectively.
Ø In the image given below, you can find the table value of Chi square with degrees of freedom on the left side and alpha levels along the top side.
Conditions for χ2 Test
Ø Each observation making up the sample for the test should be independent of each other
Ø Total number of observations used in the test must be large (≥50)
Ø The χ2 completely depends upon the degree of freedom
Ø The sample collected should be random (Random Sample)
Types of χ2 Tests
Ø Three types of Chi-square tests are there
(1). Goodness of Fit
(2). Contingency Chi-square
(3). Homogeneity Chi-Square
(1). Goodness of Fit
Ø Also called Pearson χ2
Ø Used to test whether the actual (observed) number of frequencies are similar or in ‘Good Agreement’ with the expected (theoretical) frequency.
Ø It is the common type of χ2 test used.
Ø Calculated as:
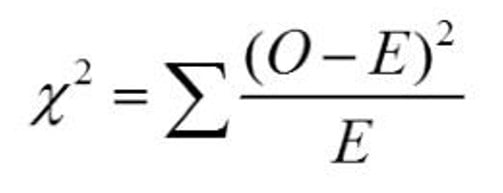
O: Observed Frequency
E: Expected Frequency
(2). Contingency Chi-Square
Ø It is also called the test of Independence of Attributes.
Ø Used to test the association between attributes when the sample data is presented as a contingency (dependency) table with any number of rows and columns.
Ø It can be used to compare one set of observations taken under a particular condition to those of a similar nature taken under different conditions. (Example: Rate of photosynthesis in open sunlight and under a shade).
Ø In the above case, there are no definite expected values, the question is, whether the results are dependent (contingent upon) or independent of the condition under which they are observed.
Ø This is why the test is called the test of independence or Contingency Test.
Ø Example: This test can be used to examine whether the height and weight of a person are independent or associated
(3). Homogeneity Chi-Square
Ø Used for calculating the homogeneity of two or more samples.
Ø The homogeneity of the sample should be calculated to decide whether the separate samples are sufficiently uniform to be added together.
Applications of Chi-Square Test
Ø Chi-square test is a very powerful test for testing the hypothesis
(a). Test of Goodness of Fit
Ø The discrepancies between observed and expected frequencies can be analyzed.
Ø With Goodness of fit, the probabilities of association between two attributes are measured.
(b). Test of independence of attributes
Ø In this test, attributes are classified into a two-way table or contingency table.
Ø This test reveals whether there is any association or relationship between two or more variables in the contingent table
| You may also like... | ||
|---|---|---|
| NOTES | QUESTION BANK | COMPETITIVE EXAMS. |
| PPTs | UNIVERSITY EXAMS | DIFFERENCE BETWEEN.. |
| MCQs | PLUS ONE BIOLOGY | NEWS & JOBS |
| MOCK TESTS | PLUS TWO BIOLOGY | PRACTICAL |
(c). Test of Homogeneity
Ø This test may be used to test the homogeneity of the attributes in respect of particular characteristics
Ø Can test the homogeneity of two samples from the same population
Ø It may also be used to test the population variance
<< Back to BIOSTATISTICS Notes Page
You May Also Like…
@. Statistical Hypothesis Testing
@. Errors in Statistics (Type I and Type II Errors)
@. Principles of Experimental Designs