
Dear Students,
Welcome to Ecology MCQ-10 (Ecology CSIR NET Questions). This MCQ set consists of Advanced Ecology / Conservation Biology / Environmental Sciences Questions taken from the previous year question papers of CSIR NET Life Sciences Examination. These questions can be used for the preparation of CSIR NET, ICMR JRF, DBT BET JRF, and GATE.
You may also like: Ecology CSIR NET Questions Part 2 | Part 3
(1). The three graphs (A, B, C) show population growth (N) pattern in relation to N or time (t)
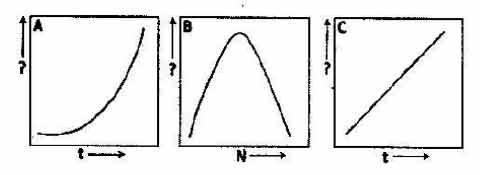
Which of the following is correct with reference to the Y-axis labeled and the type of population growth? (CSIR_2015_I)
(a). A: Y-axis: N, Exponential growth
B: Y-axis: dN/dt, Logistic growth
C: Y-axis: In(N), Exponential growth
(b). A: Y-axis: dN/dt, Exponential growth
B: Y-axis:, In(N), Logistic growth
C: Y-axis: N, Exponential growth
(c). A: Y-axis: In(N), Exponential growth
B: Y-axis:, dN/dt, Logistic growth
C: Y-axis: N, Exponential growth
(d). A: Y-axis: dN/dt, Exponential growth
B: Y-axis:, In(N), Logistic growth
C: Y-axis: N, Exponential growth
Ans. (a)
(2). Following is the diagram of three idealized survivorship curves of animals.
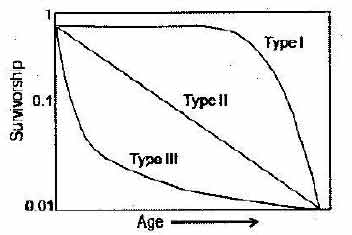
Find out the correct match between the group of animals and the respective survivorship curves (CSIR_2015_I)
(a). Marine pelagic fish and mammals – III and I respectively
(b). Marine pelagic fish and large mammals – I and II respectively
(c). Some birds and large mammals – I and III respectively
(d). Marine pelagic fish and some birds – I and III respectively
Ans. (d)
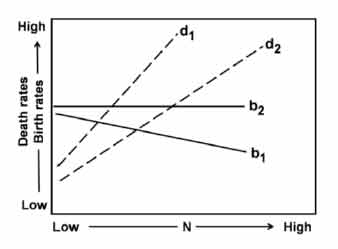
(3). Which of the following statements about the birth rates (b1, b2) and death rates (d1, d2) of species 1 and 2 indicated in the figure is NOT true? (CSIR_2015_II)
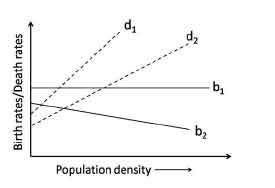
(a). Birth rates of species 1 are density- independent.
(b). Death rates of both species are density- dependent.
(c). Birth rates of species 2 are density- dependent.
(d). Density-dependent effects on death rates are similar for both the species.
Ans. (d)
(4). Important chemical reactions involved in nutrient cycling in ecosystems are given below:
(a). NO2- → NO3-
(b). N2 → NH3
(c). NH4+ → NO2-
(d). NO3- → N2
The organisms associated with these chemical reactions are: (CSIR_2015_II)
(a). a – Nitrosomonas b – Pseudomonas c – Nostoc d – Nitrobacter
(b). a – Pseudomonas b – Nitrobacter c – Nostoc d –Nitrosomonas
(c). a – Nitrobacter b – Nostoc c – Nitrosomonas d – Pseudomonas
(d). a – Nostoc b – Nitrosomonas c – Nitrobacter d – Pseudomonas
Ans. (c)
(5). Which of the following X – Y relationships does NOT follow the pattern shown in the graph? (CSIR_2015_II)
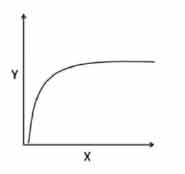
(a). Number of prey killed (Y) in relation to prey densityन(X)
(b). Photosynthetic rate (Y) in relation to light intensity (X)
(c). Species richness (Y) in relation to area (X)
(d). Tree species richness (Y) in relation to actual evapotranspiration
Ans. (d)
(6). Following table shows the number of individuals of five tree species in a community:
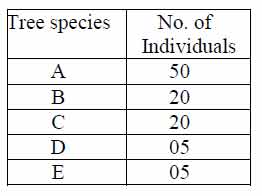
Based on the above, the Simpson’s diversity (DS) Index of the community will be (CSIR_2015_II)
(a). 0.552.
(b). 0.335.
(c). 0.435
(d). 0.345.
Ans. (b)
(7). Following table shows the presence (+) or absence (–) of five species in three communities (A, B, C):
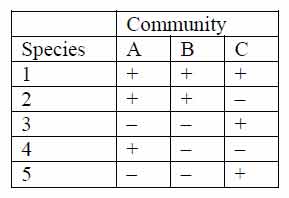
Based on the above, which of the following is the correct order of similarity between two pairs of communities? (CSIR_2015_II)
(a). A and B > B and C > A and C
(b). A and B > A and C > B and C
(c). B and C > A and B > A and C
(d). A and C > A and B > B and C
Ans. (a)
(8). In several populations, each of size N=20, if genetic drift results in a change in the relative frequencies of alleles,
(A). What is the rate of increase per generation in the proportion of populations in which the allele is lost or fixed?
(B). What is the rate of decrease per generation in each allele frequency class between 0 and 1?
The correct answer for A and B is: (CSIR_2015_II)
(a). A – 0.25, B – 0.125
(b). A – 0.025, B – 0.0125
(c). A – 0.0125, B – 0.025
(d). A – 0.125, B – 0. 25
Ans. (c)
(9). The following table shows the mean and variance of population densities of species A, B and C.
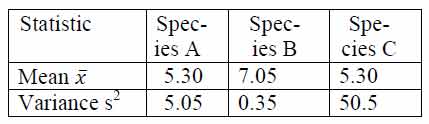
Based on the above, which of the following statements is correct? (CSIR_2016_I)
(a). Species A and B show uniform distribution, whereas species C shows clumped distribution.
(b). Species A shows random distribution, species B shows uniform distribution, and species C shows clumped distribution.
(c). Species A and B show clumped distri- bution, whereas species C shows uniform distribution.
(d). Species A shows clumped distribution, species B shows random distribution, and species C shows uniform distribution.
Ans. (a)
(10). In a lake subjected to progressive eutrophication, temporal changes in the magnitude of selected parameters (A, B, C, D) are shown in the graph
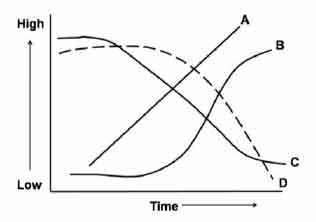
The parameters A, B, C, D are: (CSIR_2016_I)
(a). A-Green algal biomass, B – Cyano- bacterial biomass, C – Dissolved Oxygen concentration, D – Biological Oxygen Demand
(b). A- Biological Oxygen Demand, B – Cyanobacterial biomass, C – Dissolved Oxygen concentration, D – Green algal biomass
(c). A- Biological Oxygen demand, B – Green algal biomass, C – Cyanobacterial biomass, D – Dissolved Oxygen concentration\
(d). A- Cyanobacterial biomass, B – Biological Oxygen Demand, C – Green algal biomass, D – Dissolved Oxygen concentration
Ans. (b)
(11). The birth rates (b) and death rates (d) of two species 1and 2 in relation to population density (N) are shown in the graph. Which of the following is NOT true about the density dependent effects on birth rates and death rates? (CSIR_2016_I)
(a). Birth rates are density-dependent in species 1 and density-independent in species 2.
(b). Death rates are density-dependent in both the species.
(c). Density-dependent effect on birth rate is stronger in species 1 than in species 2.
(d). The density-dependent effects on death rates are similar in both the species.
Ans. (d)
(12). For two species A and B in competition, the carryingतcapacities and competition co-efficients are
KA = 150 KB = 200
α = 1.0 β = 1.3
According to the Lotka-Volterra model of interspecific competition, the outcome of competition will be: (CSIR_2016_I)
(a). Species A wins.
(b). Species B wins.
(c). Both species reach a stable equilibrium.
(d). Both species reach an unstable equilibrium.
Ans. (d)