Bioinformatics is an interdisciplinary field that analyzes and interprets biological data by combining biology, computer science, and statistics. There are various tools and techniques available for data analysis and interpretation. The software tools used in bioinformatics range from simple command-line utilities to more complex graphical programs and standalone web-services made available by various bioinformatics companies or public institutions. Here are some of the important tools in bioinformatics that every biology student should know about.
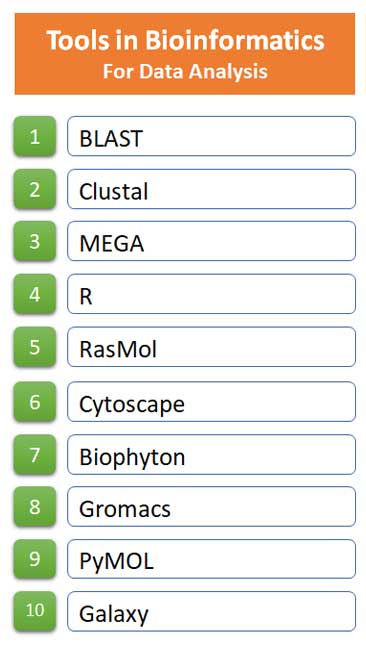
Tools in Bioinformatics
BLAST
Ø BLAST: Basic Local Alignment Search Tool
Ø A widely used bioinformatics tool that searches a database for sequences that match a query sequence.
Learn more: Top 10 Bioinformatics Databases
Ø Used to identify homologous sequences, which can provide insights into the function and evolution of genes.
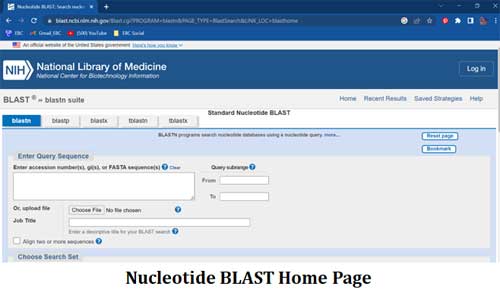
Ø Features of BLAST
o Allow for the rapid search of a large sequence database for sequences that match the query sequence.
o Rather than attempting to align the entire sequence, BLAST can identify regions of similarity between the query and database sequences.
o BLAST employs a scoring system based on residue alignment in the query and database sequences. The greater the similarity, the higher the score.
| You may also like NOTES in... | ||
|---|---|---|
| BOTANY | BIOCHEMISTRY | MOL. BIOLOGY |
| ZOOLOGY | MICROBIOLOGY | BIOSTATISTICS |
| ECOLOGY | IMMUNOLOGY | BIOTECHNOLOGY |
| GENETICS | EMBRYOLOGY | PHYSIOLOGY |
| EVOLUTION | BIOPHYSICS | BIOINFORMATICS |
o BLAST can produce E-value (expectation value), which is a measure of number of matches that are expected to occur by chance in a database of a given size.
o BLAST provides a measure of the statistical significance of the sequence similarity, based on the E-value and other parameters.
o A wide range of query options are allowed in BLAST including nucleotide or protein sequence input, and different search strategies (such as blastn, blastp, tblastn, and tblastx).
o BLAST can also be used to align multiple sequences simultaneously, allowing for comparative analysis of related sequences.
Clustal
Ø A bioinformatics tool that aligns multiple sequences to identify similarities and differences.
Ø It is used to construct phylogenetic trees, which can provide insights into the evolutionary relationships between different organisms.
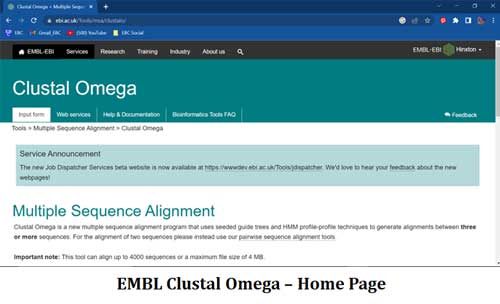
Ø Features of Clustal
o Clustal can align multiple sequences simultaneously, and generate a consensus sequence that represents the degree of similarity between the input sequences.
o Clustal offers a range of alignment options, such as progressive alignment, iterative refinement, and profile alignment.
o Clustal uses a scoring system based on the alignment of residues in the input sequences, with higher scores indicating greater similarity.
o Clustal constructs a guide tree to guide the alignment process, based on the degree of sequence similarity between the input sequences.
o Clustal provides output in various formats including plain text.
o Clustal has a user-friendly interface that allows users to select input sequences, set parameters for the alignment, and visualize the alignment results.
o Clustal allows users to customize the alignment process by modifying the scoring matrix, gap penalties, and other parameters.
o Clustal is compatible with different operating systems and can handle sequences in various formats
MEGA
Ø MEGA: Molecular Evolutionary Genetics Analysis
Ø A software package that provides tools for analysing and interpreting DNA and protein sequences.
Ø Used to construct phylogenetic trees, estimate evolutionary distances, and perform statistical analyses.
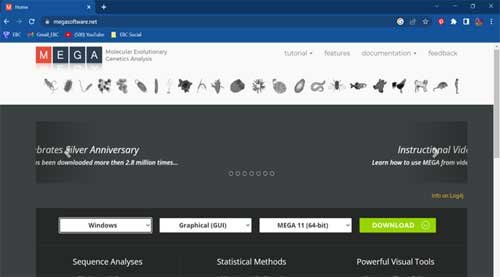
Ø Features of MEGA
o MEGA provides a wide range of methods for constructing phylogenetic trees and estimating genetic distances.
o These methods include Maximum Likelihood, Bayesian, Neighbor-Joining, UPGMA, Minimum Evolution, and Parsimony.
o It offers various methods for sequence alignment, such as Clustal and MUSCLE.
o MEGA supports both nucleotide and protein sequence analysis.
o It provides statistical analysis tools such as hypothesis testing, likelihood ratio test, and model selection.
o MEGA offers several data visualization tools, including a graphical interface for constructing and viewing phylogenetic trees, a sequence alignment editor, and a scatter plot tool.
o MEGA can integrate with other software, including MUSCLE, Clustal, and PAUP, allowing for a wider range of sequence analysis methods.
R
Ø R is a programming language and software environment for statistical computing and graphics.
Ø It is widely used in bioinformatics for data analysis and visualization.
Ø Features of R
o R can be used to perform many data analysis tasks, including data normalization, and data filtering.
o It can perform the statistical analysis of large-scale omics data.
o R provides visualization tools for the exploration and presentation of complex biological data, such as heatmaps, scatter plots, line graphs, and bar charts.
o R provides a collection of machine learning algorithms that can be used for classification, clustering, and prediction tasks in bioinformatics.
o R is used for analysing and visualizing high-throughput genomics data, including RNA-seq, ChIP-seq, and DNA-seq.
o R can also be used to analyse and visualize proteomics data, including data of mass spectrometry and protein-protein interaction networks.
o R can be easily integrated with other bioinformatics tools such as ClustalW.
o R is used for data mining and pattern recognition in large-scale biological datasets.
RasMol
Ø RASMOL is a molecular visualization tool.
Ø A computer program developed to visualize the 3D structure of proteins.
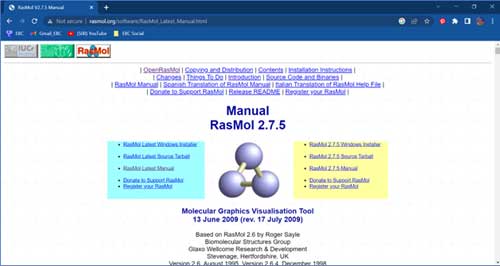
Ø Features of RasMol
o RasMol is powerful tool to visualize 3D Structures of proteins.
o Has Graphical User Interface (GUI).
o Can generate high quality images for publications.
o Enable scripting to other functions – editing, mutation studies etc.
o Can accept sequence from PDB.
o Different parts of the proteins can be coloured differently.
o Displayed models can be rotated and zoomed with computer mouse.
o Can be operated in all OS (Windows, Linux Mac etc.)
Cytoscape
Ø Cytoscape is a bioinformatics tool for visualizing and analyzing molecular interaction networks.
Ø It is used to identify and interpret the interactions between genes, proteins, and other molecules.
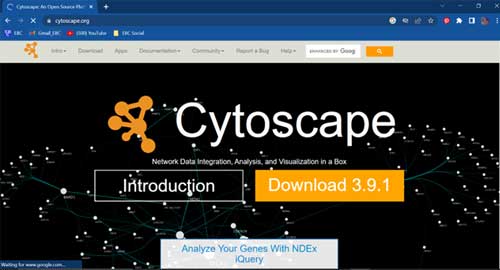
Ø Features of Cytoscape
o Cytoscape has a customizable user interface for visualizing and exploring complex networks.
o It has wide range of algorithms and tools for analyzing networks, such as network clustering, pathway enrichment analysis, and network topology analysis.
o Can analyze data from a variety of sources, including gene expression, proteomics, and functional annotation databases.
o Flexible plugin architecture of Cytoscape allows users to extend its functionality
o It is available on Windows, Mac, and Linux operating systems.
o Cytoscape supports a variety of network and data file formats, including those from popular databases like BioGRID and STRING.
Biopython
Ø Biopython is a set of Python tools for bioinformatics analysis and data manipulation.
Ø It provides a wide range of modules for DNA and protein sequence analysis, phylogenetics, and structural biology.
Ø Features of Biopython
o Biopython has the tools for all types of sequences, including DNA, RNA, and protein sequences.
o Can perform pairwise and multiple sequence alignments.
o Can prepare and visualize phylogenetic trees.
o Can retrieve from various biological databases such as NCBI, UniProt and PDB.
o A variety of data visualization tools available
GROMACS
Ø GROMACS is a molecular dynamics simulation software package that is used to simulate the behavior of biomolecules, such as proteins and nucleic acids.
Ø It can be used to study protein folding, ligand binding, and other molecular processes.
PyMOL
Ø PyMOL is a molecular visualization software tool
Ø Used to create high-quality 3D images of proteins and other molecules
Ø Can be used to analyse and interpret protein structures and interactions.
Galaxy
Ø Galaxy is an open-source web-based platform for data analysis in bioinformatics.
Ø It provides a user-friendly interface for performing various types of bioinformatics analyses, such as sequence alignment, RNA-seq analysis, and variant calling.
Swiss-Model
Ø Swiss-Model is a software tool for predicting the 3D structure of proteins.
Ø It uses comparative modelling techniques to generate high-quality models of protein structures based on homologous sequences.
These bioinformatics tools provide powerful tools for analysing and interpreting biological data. They are widely used in research and can provide valuable insights into the structure, function, and evolution of genes and proteins.
<<< Back to BIOINFORMATICS Notes
Dear readers
We believe that this article helped you to understand the Top Ten Tools in Bioinformatics for Data Analysis. I would like to take this opportunity to request your feedback and comments on the topics I have covered. Whether you have a suggestion, a question about the topic, or simply want to share your thoughts, I would love to hear from you. Your comments provide me with the opportunity to engage in meaningful discussion and continue to write with the best possible content in Biology.
So, please don’t hesitate to leave a comment below. I appreciate your support and look forward to hearing from you.
Best regards, [Admin, EasyBiologyClass]

looks good but you have mixed up languages and Tools . For example you have not mentioned about igraph or gephi if talk about network analysis tools