
Dear Students,
Welcome to Evolution MCQ-07 (Evolution CSIR NET Questions). This MCQ set consists of Advanced (PG Level) Evolution / Phylogeny / Phylogenetics Multiple Choice Questions taken from the previous year question papers of CSIR NET Life Sciences Examination. These questions can be used for the preparation of CSIR NET, ICMR JRF, DBT BET JRF, GATE and other University Ph.D Entrance Examinations.
You may also like: Evolution Notes | Evolution PPT
(1). Match major events in the history of life with Earth’s geological period. (CSIR_2016_I)
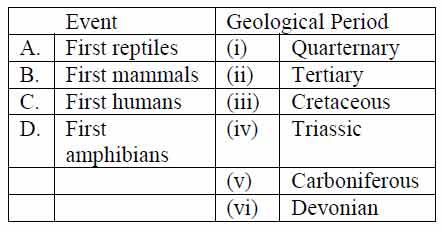
(a). A – (v); B – (i); C – (ii); D – (v)
(b). A – (v); B – (iv); C – (i); D – (vi)
(c). A – (vi); B – (iv); C – (ii); D – (vi)
(d). A – (iii); B – (i); C – (vi); D – (v)
Ans. (b)
(2). Following is a cladogram showing phylogenetic relationships among a group of plants:
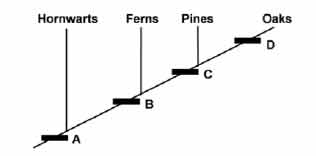
In the above representation, A, B, C and D respectively represent: (CSIR_2016_I)
(a). Xylem and phloem, embryo, flower, seed.
(b). Embryo, xylem and phloem, seed, flowers.
(c). Embryo, xylem and phloem, flower, seed.
(d). Xylem and phloem, flower, embryo, seed.
Ans. (b)
(3). A particular behavioural variant affects fitness of an organism. The relationship between the frequency of the variant in the population and fitness are plotted below. In which of these cases is the behavioural variant most likely to reach a frequency of 1? (CSIR_2016_I)
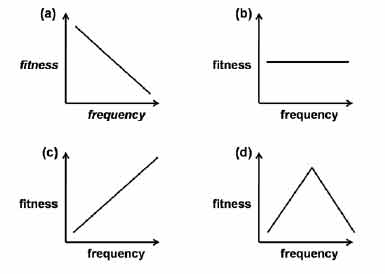
(a). Only b
(b). Only c
(c). b and d
(d). a and d
Ans. (b)
(4). The coefficient of relatedness between individuals A and B, A and D, and between D and C in the diagram below is: (CSIR_2016_I)
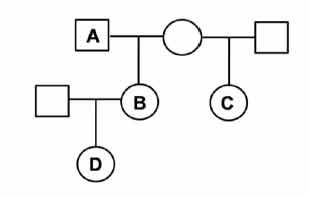
(a). 1. 0.5, 0.25, 0.125 respectively.
(b). 2. 0.5, 0.5, 0.25 respectively.
(c). 3. 0.5, 0.25, 0.75 respectively.
(d). 4. 0.125, 0.5, 0.5 respectively.
Ans. (a)
(5). Which one of the following trees represents a fully resolved phylogram? (CSIR_2017_II)
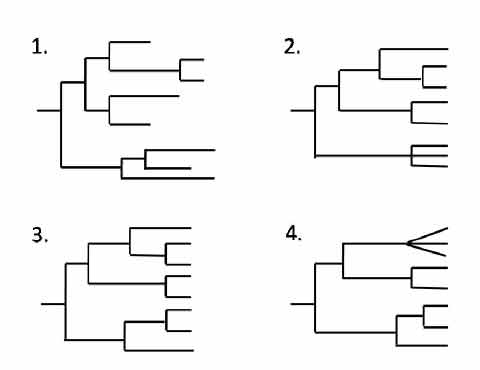
(a). Dendrogram 1
(b). Dendrogram 2
(c). Dendrogram 3
(d). Dendrogram 4
Ans. (a)
(6). A gene ‘X’ in Drosophila contributes to inviability of hybrids. The phylogeny below shows the evolutionary history of gene ‘X’ and on each branch the numbers indicate the non-synonymous/synonymous substitutions.
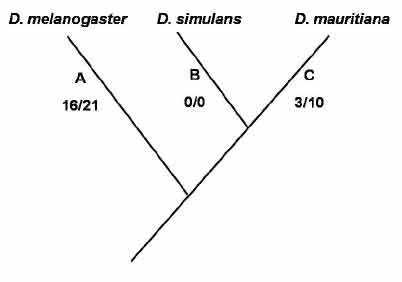
Based on the above information, select the correct statement from the choices below: (CSIR_2017_II)
(a). High proportion of non-synonymous changes at A indicates evolution by natural selection.
(b). High proportion of synonymous changes at A indicates absence of natural selection.
(c). Equal proportion of non-synonymous and synonymous changes at B indicates deleterious selection.
(d). Low proportion of non-synonymous changes at C indicates positive selection.
Ans. (a)
(7). When the electrical response of the two receptors A1 and A2 in a noctuid moth that was exposed to a variety of sounds was measured, it produced the following patterns:
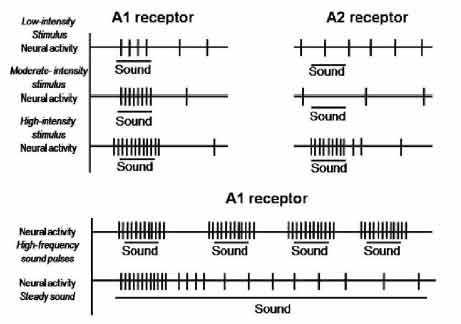
Given this, which one of the following statements is INCORRECT: (CSIR_2017_II)
(a). The A1 receptor is sensitive to sound of low to high intensity.
(b). A2 receptor begins to produce action potentials only when a sound is loud.
(c). Both the receptors have similar response to high intensity sound.
(d). The A1 receptor fires much more frequently to steady, uninterrupted sounds than to high frequency pulses of sound.
Ans. (d)
(8). A barn owl sits on its perch 10m above ground. It hears a mouse underneath on the ground at an angle as shown in the figure below.
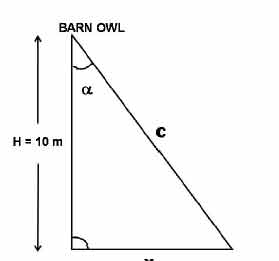
The error range with which it can locate the mouse on the ground is given by (CSIR_2017_II)
(a). tanα= X/H
(b). cosα= X/H
(c). sinα= X/H
(d). cosα= X/C
Ans. (a)
(9). A 20-week old infant was exposed to the following stimuli and the responses were measured.
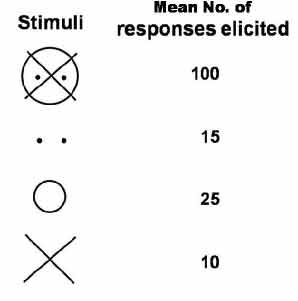
Based on the response patterns shown above to the given stimuli, select the correct theory that best describes the observed responses. (CSIR_2017_II)
(a). Heterogenous summation
(b). Gestalt principle
(c). Supernormal stimuli
(d). Sign stimulus
Ans. (b)
(10). When James R Brown and W Ford Doolittle (1997) reconstructed the tree of life using a variety of different genes, they found that different genes gave fundamentally different phylogenies as shown below. Note that the genes are unique to the specific trees.
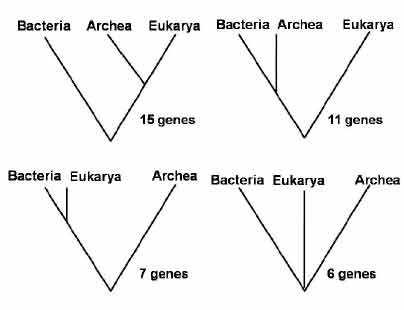
From the given options select the process that best explains the observed discrepancies between the trees. (CSIR_2017_II)
(a). Ppolyploidization
(b). Horizontal gene transfer
(c). Allopatric speciation
(d). Localized extinctions
Ans. (b)